Elevate your Ecommerce Success with Live Analytics
Elevate your Ecommerce Success with Live Analytics
Elevate your Ecommerce Success with Live Analytics
Elevate your Ecommerce Success with Live Analytics
Understand user actions, enhance conversion rates, and achieve scalable growth – seamlessly in one platform.
Understand user actions, enhance conversion rates, and achieve scalable growth – seamlessly in one platform.
Understand user actions, enhance conversion rates, and achieve scalable growth – seamlessly in one platform.
Understand user actions, enhance conversion rates, and achieve scalable growth – seamlessly in one platform.

Elevate your Ecommerce Success with Live Analytics
Understand user actions, enhance conversion rates, and achieve scalable growth – seamlessly in one platform.
Top ecommerce product and marketing teams leverage data to create exceptional user experiences
Top ecommerce product and marketing teams leverage data to create exceptional user experiences
Top ecommerce product and marketing teams leverage data to create exceptional user experiences
Top ecommerce product and marketing teams leverage data to create exceptional user experiences


Gain Actionable Insights to Drive Conversions
Gain Actionable Insights to Drive Conversions
Gain Actionable Insights to Drive Conversions
Gain Actionable Insights to Drive Conversions
Gain Actionable Insights to Drive Conversions
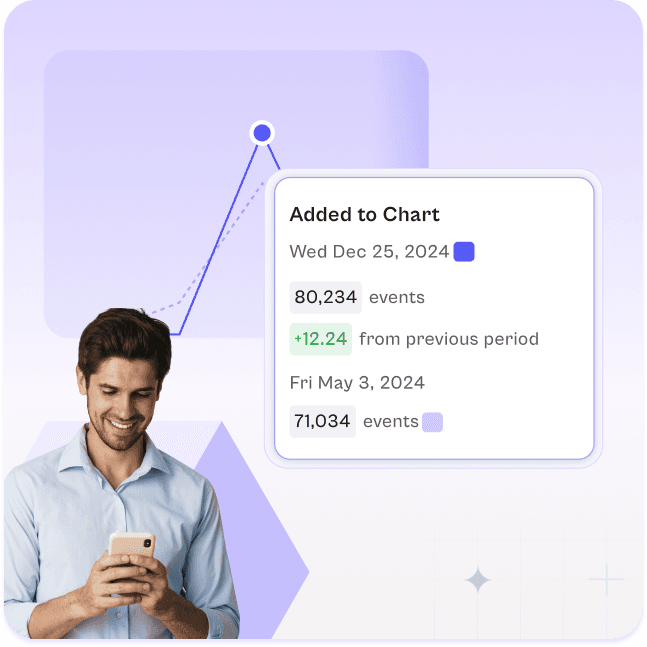
eCommerce analytics empowers brands to turn data into decisions. By leveraging insights from customer behavior, traffic sources, and campaign performance, businesses can optimize every touchpoint along the buyer’s journey. The right analytics platform enables real-time tracking of user interactions, helping you identify what drives conversions and what hinders them.
eCommerce analytics empowers brands to turn data into decisions. By leveraging insights from customer behavior, traffic sources, and campaign performance, businesses can optimize every touchpoint along the buyer’s journey. The right analytics platform enables real-time tracking of user interactions, helping you identify what drives conversions and what hinders them.
eCommerce analytics empowers brands to turn data into decisions. By leveraging insights from customer behavior, traffic sources, and campaign performance, businesses can optimize every touchpoint along the buyer’s journey. The right analytics platform enables real-time tracking of user interactions, helping you identify what drives conversions and what hinders them.
eCommerce analytics empowers brands to turn data into decisions. By leveraging insights from customer behavior, traffic sources, and campaign performance, businesses can optimize every touchpoint along the buyer’s journey. The right analytics platform enables real-time tracking of user interactions, helping you identify what drives conversions and what hinders them.
Understand the 'Why' Behind Customer Behavior
Understand the 'Why' Behind Customer Behavior
Understand the 'Why' Behind Customer Behavior
Understand the 'Why' Behind Customer Behavior
Understand the 'Why' Behind Customer Behavior
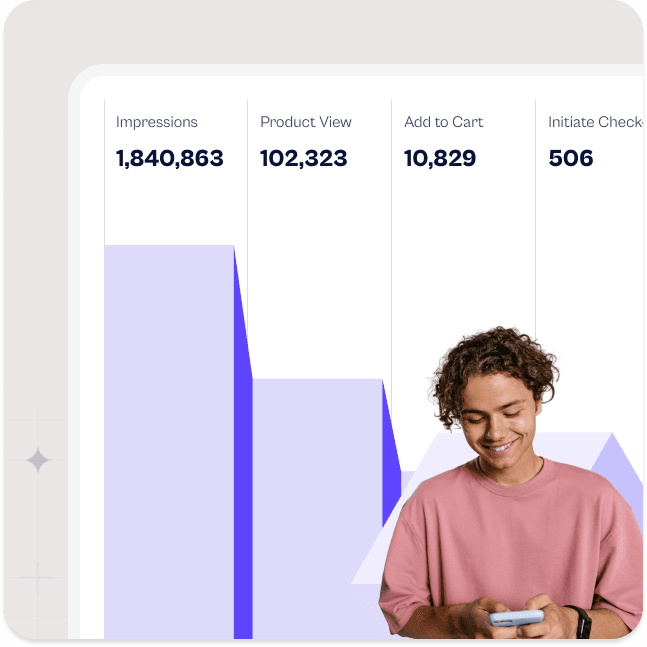
Beyond metrics, understanding the motivations behind customer actions is critical. eCommerce analytics dives into deeper layers of data, revealing patterns in browsing, cart abandonment, and purchasing behavior. These insights allow businesses to create more personalized experiences and address pain points that impact conversion rates.
Beyond metrics, understanding the motivations behind customer actions is critical. eCommerce analytics dives into deeper layers of data, revealing patterns in browsing, cart abandonment, and purchasing behavior. These insights allow businesses to create more personalized experiences and address pain points that impact conversion rates.
Beyond metrics, understanding the motivations behind customer actions is critical. eCommerce analytics dives into deeper layers of data, revealing patterns in browsing, cart abandonment, and purchasing behavior. These insights allow businesses to create more personalized experiences and address pain points that impact conversion rates.
Beyond metrics, understanding the motivations behind customer actions is critical. eCommerce analytics dives into deeper layers of data, revealing patterns in browsing, cart abandonment, and purchasing behavior. These insights allow businesses to create more personalized experiences and address pain points that impact conversion rates.


Omni-channel Performance in One Place
Omni-channel Performance in One Place
Omni-channel Performance in One Place
Omni-channel Performance in One Place
Omni-channel Performance in One Place
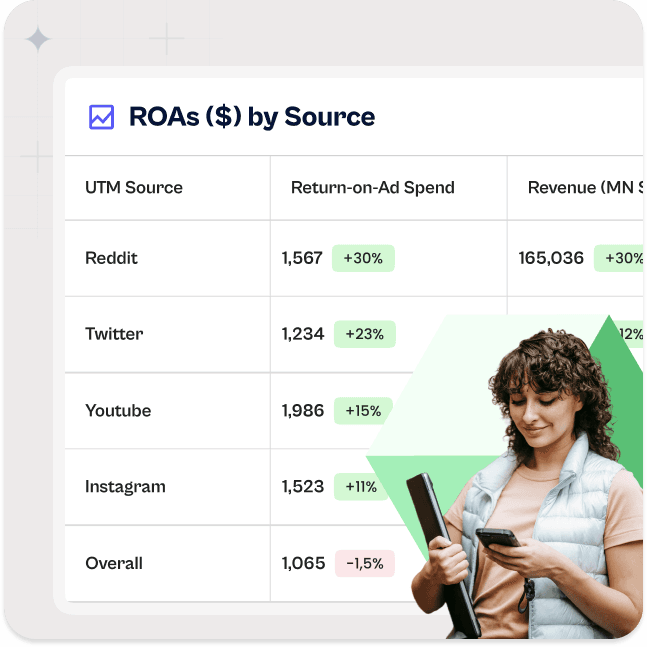
Today’s customers interact with brands across multiple channels—email, social media, paid ads, and more. With eCommerce analytics, businesses gain a unified view of these touchpoints, measuring how each channel contributes to overall performance. This comprehensive perspective helps allocate budget effectively and drive higher returns.
Today’s customers interact with brands across multiple channels—email, social media, paid ads, and more. With eCommerce analytics, businesses gain a unified view of these touchpoints, measuring how each channel contributes to overall performance. This comprehensive perspective helps allocate budget effectively and drive higher returns.
Today’s customers interact with brands across multiple channels—email, social media, paid ads, and more. With eCommerce analytics, businesses gain a unified view of these touchpoints, measuring how each channel contributes to overall performance. This comprehensive perspective helps allocate budget effectively and drive higher returns.
Today’s customers interact with brands across multiple channels—email, social media, paid ads, and more. With eCommerce analytics, businesses gain a unified view of these touchpoints, measuring how each channel contributes to overall performance. This comprehensive perspective helps allocate budget effectively and drive higher returns.
Predict, Personalize, and Grow with Confidence
Predict, Personalize, and Grow with Confidence
Predict, Personalize, and Grow with Confidence
Predict, Personalize, and Grow with Confidence
Predict, Personalize, and Grow with Confidence
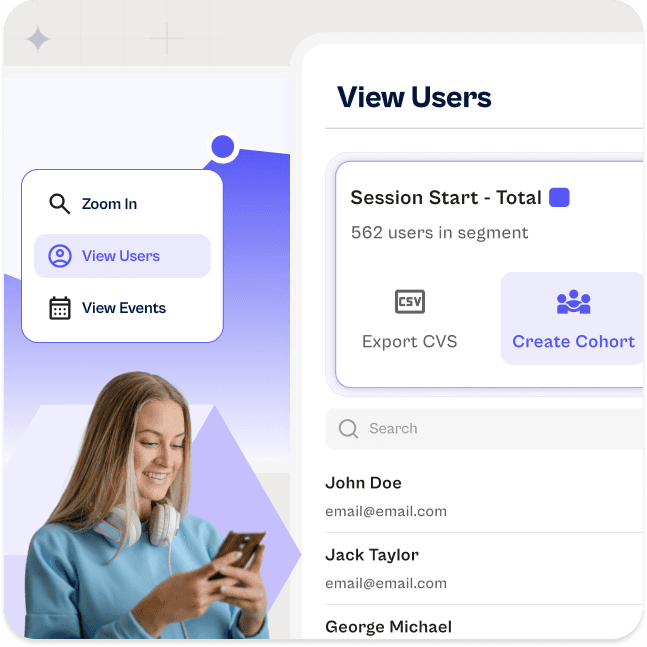
Modern eCommerce analytics isn't just reactive—it’s predictive. AI-powered tools forecast customer lifetime value (CLTV), churn probability, and next-best offers, allowing businesses to take proactive steps. From personalized recommendations to loyalty strategies, analytics provides the foundation for scalable, sustainable growth.
Modern eCommerce analytics isn't just reactive—it’s predictive. AI-powered tools forecast customer lifetime value (CLTV), churn probability, and next-best offers, allowing businesses to take proactive steps. From personalized recommendations to loyalty strategies, analytics provides the foundation for scalable, sustainable growth.
Modern eCommerce analytics isn't just reactive—it’s predictive. AI-powered tools forecast customer lifetime value (CLTV), churn probability, and next-best offers, allowing businesses to take proactive steps. From personalized recommendations to loyalty strategies, analytics provides the foundation for scalable, sustainable growth.
Modern eCommerce analytics isn't just reactive—it’s predictive. AI-powered tools forecast customer lifetime value (CLTV), churn probability, and next-best offers, allowing businesses to take proactive steps. From personalized recommendations to loyalty strategies, analytics provides the foundation for scalable, sustainable growth.


Knowledge Hub
Our Resources
Explore expert insights, guides, and tools designed to help you make informed decisions and drive success.
Blog
Ecommerce Analytics with B2Metric
Unlock unique perspectives on user behavior, interaction patterns, and growth potential
2024 Reports
2024 Ecommerce Benchmarks
Unlock unique perspectives on user behavior, interaction patterns, and growth potential
Customer Story
Ultimate Success Story
Learn how leading brands leverage B2Metric to boost conversions and gain deeper insights
Start Your
SUPER ANALYTICS
Journey Now
Start Your
SUPER ANALYTICS
Journey Now
Start Your
SUPER ANALYTICS
Journey Now

Create New Report
Business KPI
Performance Marketing
Marketing Automations
North Star Metrics
Funnel
Funnel is a marketing model used to track the customer journey.
login
%100
Opened
%50
Created
Finised
%25
%12
User Retantion
User retention measures active users and churn with your data.
1
2
3
4
Audience Tracker
An audience tracker table is used to track target audiences and their characteristics.
0
100
200
300
400
500
600
RFM Customer Segmentation
RFM segmentation divides customers based on purchase behavior.
Low
High
Screen Flow
Screen Flow shows the flow between stages of a process.
node 1
node 1
node 1
drop off
node 2
level 2
level 2
level 3
node 3
node 1
node 1
node 2
node 1
node 2
node 3
Chart Wizard
User retention measures active users and churn with your data.
Pie Chart
Bar Chart
Line Chart
Table
Knowledge Hub
Our Resources
Explore expert insights, guides, and tools designed to help you make informed decisions and drive success.
Blog
Ecommerce Analytics with B2Metric
Unlock unique perspectives on user behavior, interaction patterns, and growth potential
2024 Reports
2024 Ecommerce Benchmarks
Unlock unique perspectives on user behavior, interaction patterns, and growth potential
Customer Story
Ultimate Success Story
Learn how leading brands leverage B2Metric to boost conversions and gain deeper insights
Create New Report
Business KPI
Performance Marketing
Marketing Automations
North Star Metrics
Funnel
Funnel is a marketing model used to track the customer journey.
login
%100
Opened
%50
Created
Finised
%25
%12
User Retantion
User retention measures active users and churn with your data.
1
2
3
4
Audience Tracker
An audience tracker table is used to track target audiences and their characteristics.
0
100
200
300
400
500
600
RFM Customer Segmentation
RFM segmentation divides customers based on purchase behavior.
Low
High
Screen Flow
Screen Flow shows the flow between stages of a process.
node 1
node 1
node 1
drop off
node 2
level 2
level 2
level 3
node 3
node 1
node 1
node 2
node 1
node 2
node 3
Chart Wizard
User retention measures active users and churn with your data.
Pie Chart
Bar Chart
Line Chart
Table
FAQ
Frequently Asked Questions
Frequently Asked Questions
Frequently Asked Questions
Frequently Asked Questions
What does B2Metric do?
What does B2Metric do?
What does B2Metric do?
What does B2Metric do?
What does B2Metric do?
What sets B2Metric apart from competitors?
What sets B2Metric apart from competitors?
What sets B2Metric apart from competitors?
What sets B2Metric apart from competitors?
What sets B2Metric apart from competitors?
Who are B2Metric’s main customers?
Who are B2Metric’s main customers?
Who are B2Metric’s main customers?
Who are B2Metric’s main customers?
Who are B2Metric’s main customers?
Can B2Metric integrate with existing tools and software?
Can B2Metric integrate with existing tools and software?
Can B2Metric integrate with existing tools and software?
Can B2Metric integrate with existing tools and software?
Can B2Metric integrate with existing tools and software?
What are the key features of B2Metric’s platform?
What are the key features of B2Metric’s platform?
What are the key features of B2Metric’s platform?
What are the key features of B2Metric’s platform?
What are the key features of B2Metric’s platform?
Does B2Metric offer customer support or training?
Does B2Metric offer customer support or training?
Does B2Metric offer customer support or training?
Does B2Metric offer customer support or training?
Does B2Metric offer customer support or training?


Product
Resources
Top Blogs
Copyright © 2025 B2Metric | All Rights Reserved
Product
Subscribe to our newsletter!
Copyright © 2025 B2Metric | All Rights Reserved


Product
Resources
Copyright © 2025 B2Metric | All Rights Reserved
Product
Subscribe to our newsletter!
Copyright © 2025 B2Metric | All Rights Reserved

Product
Subscribe to our newsletter!
Copyright © 2025 B2Metric | All Rights Reserved


