







Skip to content

Data-Driven Growth Platform

Increase Your Campaign Revenue by Up to 20%

Discover Customers at Risk of Churn with Predictive Audience Targeting

Drive tangible revenue growth from your discount campaigns with data-driven audience predictions and smarter budget allocation.

Revenue Increase
+20%
Churn Reduction
-25%
Budget Optimization
+15%
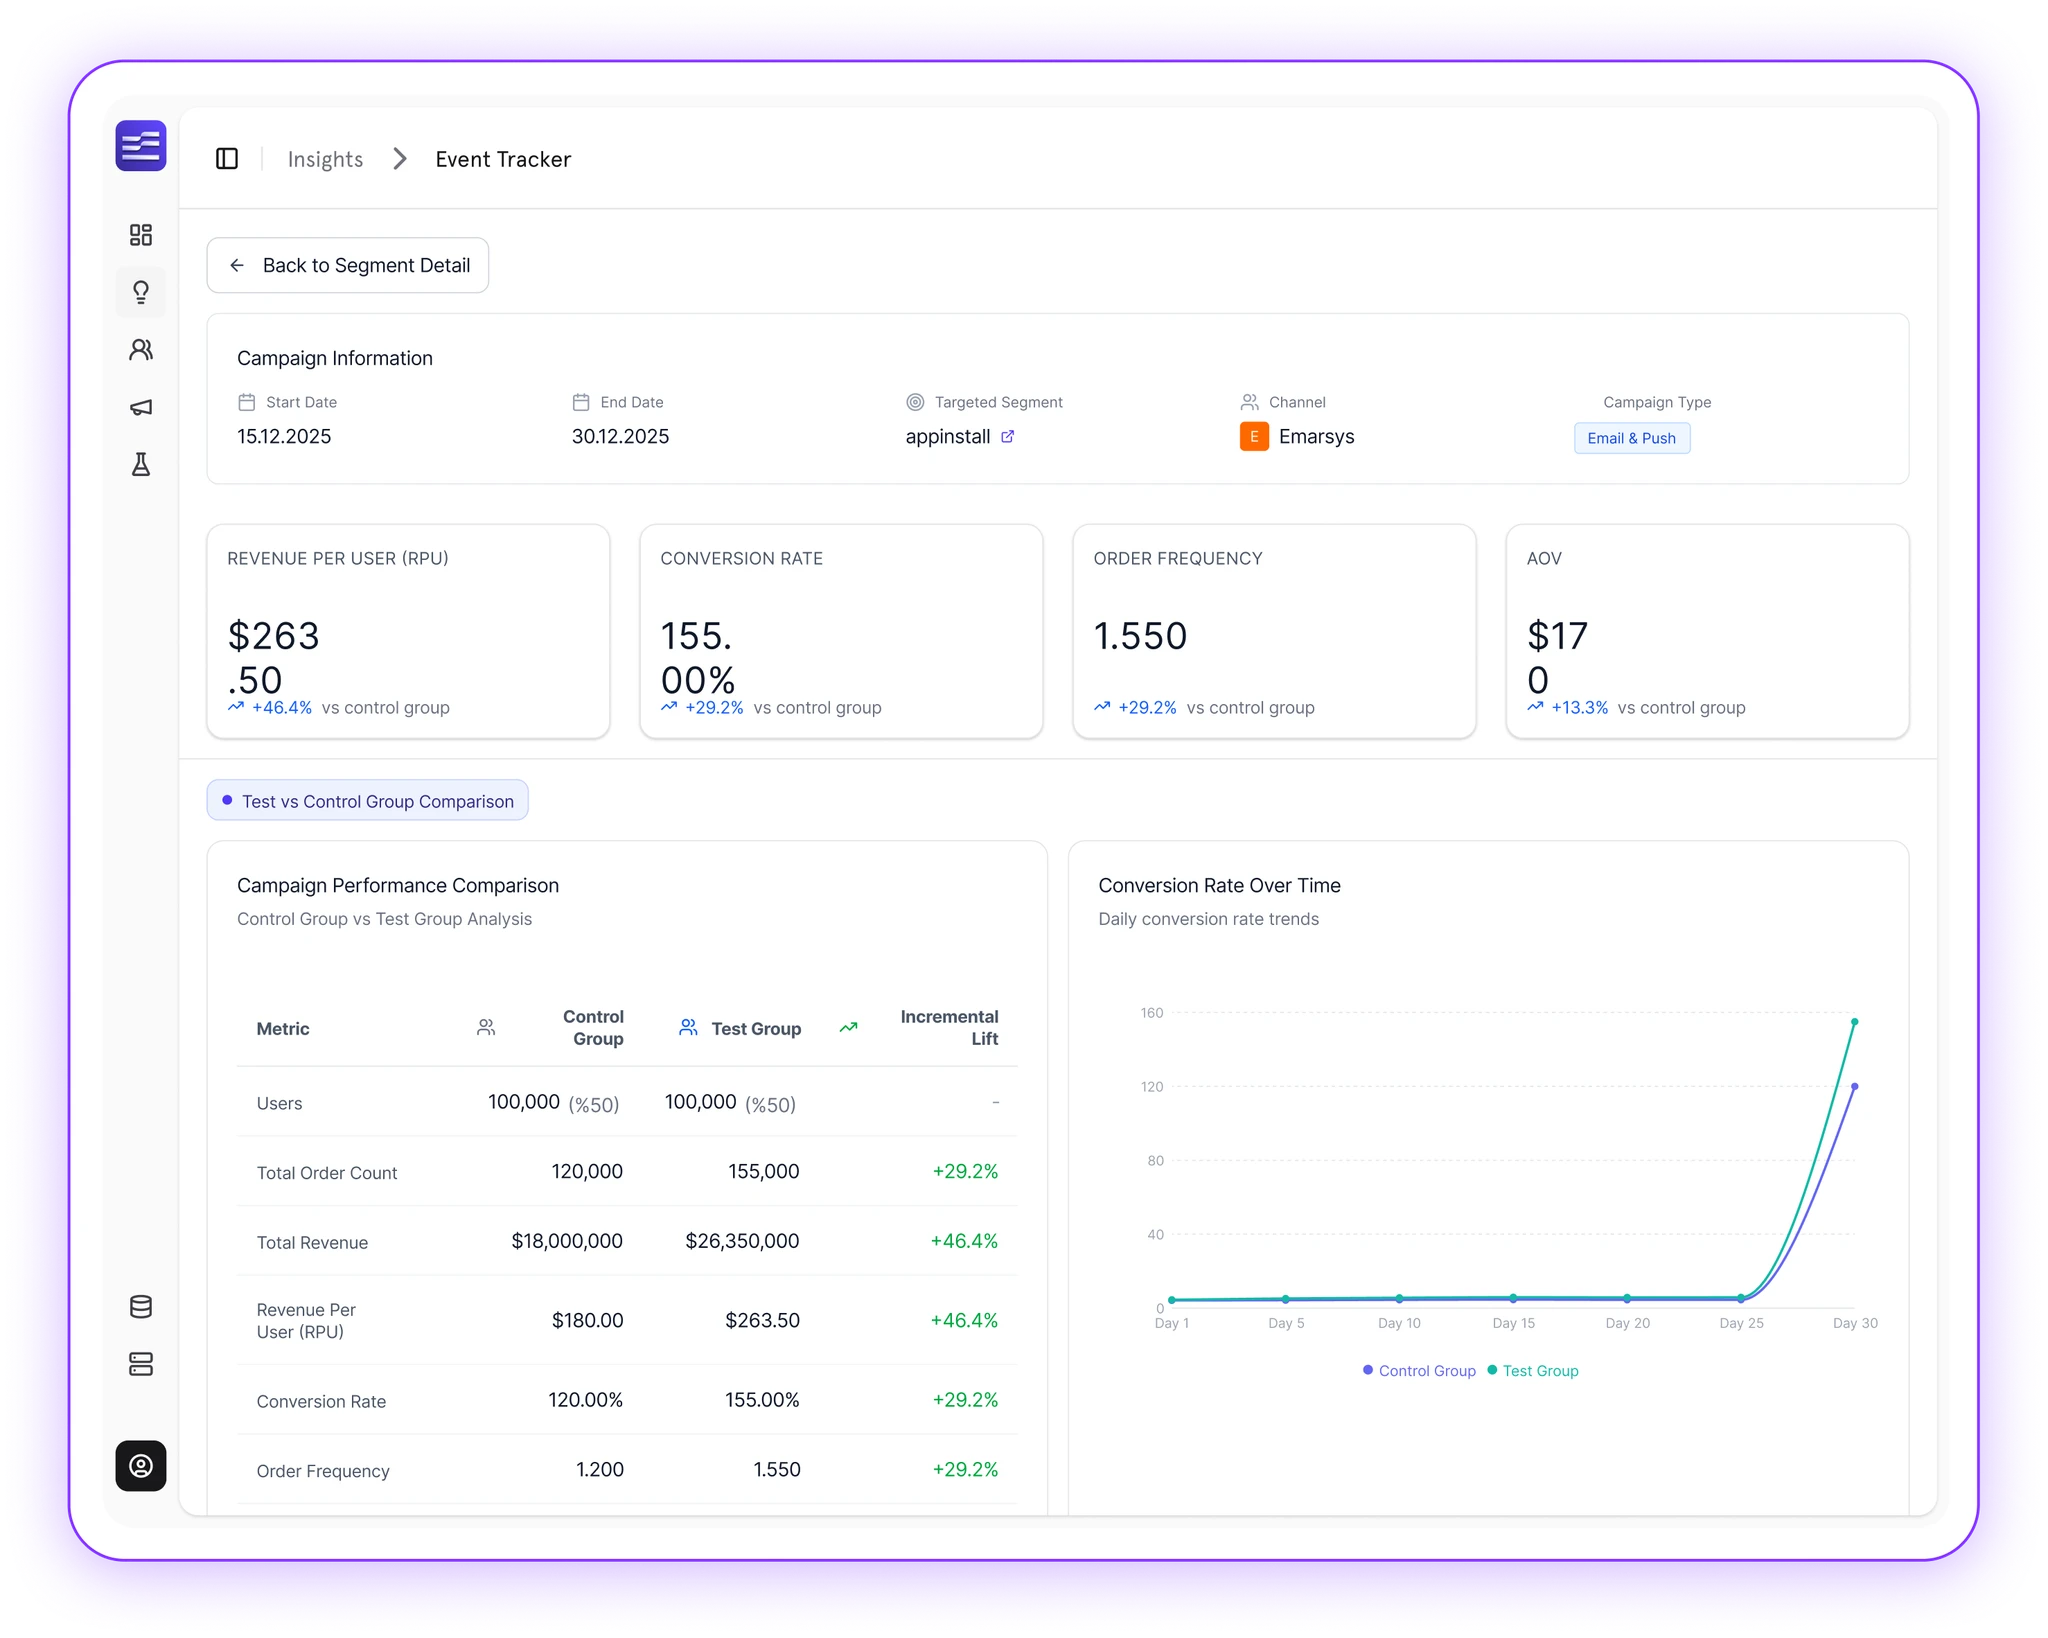
Campaign dashboard comparing test and control group revenue, conversion rate and order frequency
  • Türk Telekom
  • Aktif Bank
  • MetLife
  • Allianz
  • MediaMarkt
  • Avis
  • BKT
  • Muud
  • Papara
  • GAIN
  • Insider
  • Jirnexu

The Smart Way to Campaign

Stop wasting budget on customers who would order anyway

Traditional

Manual Segmentation

Your Campaign Audience:

  • High RetentionWould order anyway
  • Churn RiskNeed incentive

Campaign Budget

$10,000

Spent On All Manually Segmented Customers

  • Wasted discounts on loyal customers
  • Inefficient budget allocation
  • Lower profit margins

Total Revenue$15,000

Recommended

Smart Targeting

Predictive Segmentation

High Retention (No Campaign Needed):

Will order Naturally

Churn Risk (Targeted Campaign):

Receive incentive

Campaign Budget

$8,500

Spent ONLY on 3 churn-risk customers

Saved $1,500

  • No wasted budget on loyal customers
  • Optimized budget allocation
  • Higher profit margins

Total Revenue$18,000

The Result: More Revenue, Less Budget

Higher Revenue
+20%
Less Campaign Spend
-15%
Better ROI
+20%

Test vs Control Group Comparison

Campaign Performance Comparison

Control Group vs Test Group Analysis

Campaign Information

Start Date
15.12.2025
End Date
30.12.2025
Targeted Segment
appinstall
Channel
Emarsys
Campaign Type
Email & Push
Revenue per User (RPU)
$263.50
+46.4%vs control group
Conversion Rate
155.00%
+29.2%vs control group
Order Frequency
1.550
+29.2%vs control group
AOV
$170
+13.3%vs control group
Campaign performance: control group versus test group
MetricControl GroupTest GroupIncremental Lift
Users100,000 (%50)100,000 (%50)-
Total Order Count120,000155,000+29.2%
Total Revenue$18,000,000$26,350,000+46.4%
Revenue Per User (RPU)$180.00$263.50+46.4%
Conversion Rate120.00%155.00%+29.2%
Order Frequency1.2001.550+29.2%
AOV$150.00$170.00+13.3%

Conversion Rate Over Time— daily conversion rate trends, trending up by 5.2% this month (20 November 2025 - 20 December 2025).

Start YourSUPER ANALYTICSJourney Now